# System Information

## Chapter 16.2: Monitoring EDCC Platform Health

Learn how to monitor the health of the EDCC host system, manage its core settings, and perform software updates.

> 🔐 **Organization Administrator Only**
>
> * **Required Role**: Organization Admin only
> * **Access Level**: Complete EDCC platform administration
> * **Restriction**: POD Admin and Viewers cannot access this section
> * **Purpose**: EDCC platform monitoring and system health

***

## Overview: The EDCC Engine Room Control Panel

The **`System → System Information`** page is the central administrative dashboard for the EDCC platform itself, not the nodes it manages. Think of it as the control panel for the "engine room"—the underlying host system where the EDCC Docker container is running.

From here, an Organization-level Admin can perform three critical tasks:

* **Monitor Host System Health**: Check the resource usage to ensure the platform has enough power to run efficiently.
* **Manage Core Platform Settings**: Set the global time zone for accurate, platform-wide logging.
* **Perform Software Upgrades**: Keep the EDCC application up-to-date with the latest features and security patches.

***

### Task 1: Monitoring Host System Health (The Summary Tab)

This tab is your real-time "health gauge" for the host machine. If you find that the EDCC web interface is slow or unresponsive, this is the first place to investigate. High resource usage on the host system is a common cause of platform performance issues.

<figure><img src="https://content.gitbook.com/content/iGPGTG6LFrVfBRB76ZPF/blobs/4Lt0UodYR3JawzGyVI8M/image.png" alt=""><figcaption><p><mark style="background-color:$info;">
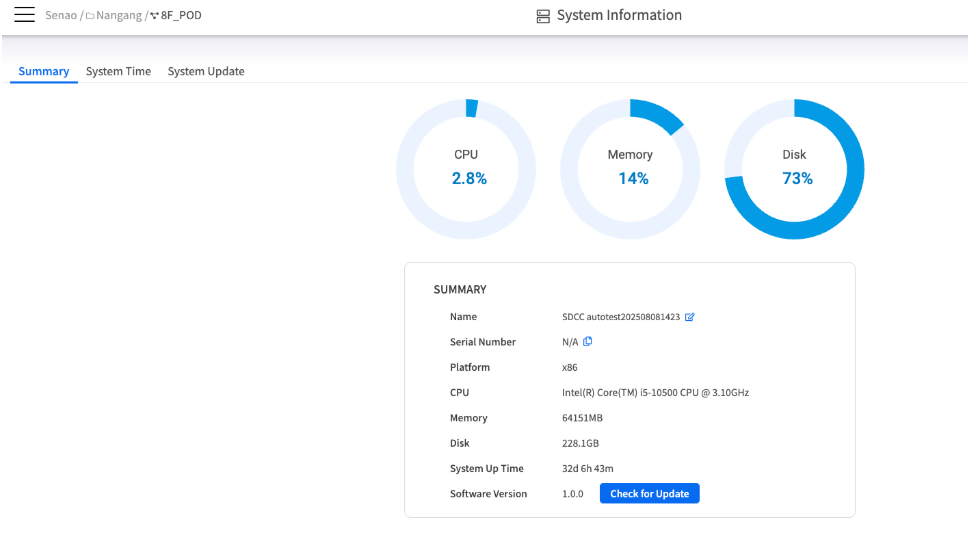
The Summary tab, showing the resource meters and system details.</mark></p></figcaption></figure>

#### **Resource Usage Meters**

These three circular meters display the current resource load on the host system:

<table><thead><tr><th width="98.44921875">Meter</th><th>Purpose</th><th>Monitoring Guidelines</th></tr></thead><tbody><tr><td><strong>CPU</strong></td><td>The percentage of total CPU capacity currently in use</td><td>Monitor for sustained high usage patterns</td></tr><tr><td><strong>Memory</strong></td><td>The percentage of total RAM currently consumed</td><td>Watch for memory leaks or capacity limits</td></tr><tr><td><strong>Disk</strong></td><td>The percentage of total disk storage space currently occupied</td><td>Plan for storage expansion before limits</td></tr></tbody></table>

{% hint style="success" %}
**Best Practice: Proactive Performance Management**

Regularly monitor these meters. If any of them consistently show high usage (e.g., above 85%), it may indicate that the host system needs more resources (e.g., more RAM or disk space) to support your management workload.
{% endhint %}

#### **System Details Explained**

This panel provides key specifications about the EDCC platform and its host environment.

<table><thead><tr><th width="185.3125">Field</th><th>Description &#x26; Why It Matters</th></tr></thead><tbody><tr><td><strong>Name / Platform</strong></td><td>The EDCC instance name and the CPU architecture of the host system (e.g., x86).</td></tr><tr><td><strong>CPU / Memory / Disk</strong></td><td>The model and total capacity of the host system's hardware resources. <strong>Why it matters</strong>: This allows you to quickly audit the host's specifications without needing to log in to the underlying operating system.</td></tr><tr><td><strong>System Up Time</strong></td><td>The duration for which the host system has been running continuously. <strong>Why it matters</strong>: A recent uptime can indicate an unexpected reboot of the host machine, which could explain platform unavailability.</td></tr><tr><td><strong>Software Version</strong></td><td>The currently installed version of the EDCC software. <strong>Why it matters</strong>: This is the first piece of information you will need when contacting technical support.</td></tr><tr><td><strong>Check for Update</strong></td><td>A button to manually verify if a newer version of the EDCC software is available.</td></tr></tbody></table>

***

### Task 2: Managing Core Platform Settings (The System Time Tab)

This tab is used to set the global "master clock" for the EDCC platform. Setting the correct platform time zone is critical during initial deployment to ensure that all entries in the Event Log have accurate timestamps, vital for security audits and troubleshooting.

<figure><img src="https://content.gitbook.com/content/iGPGTG6LFrVfBRB76ZPF/blobs/5f737zi4SuFfsgacQozw/image.png" alt=""><figcaption><p><mark style="background-color:$info;">
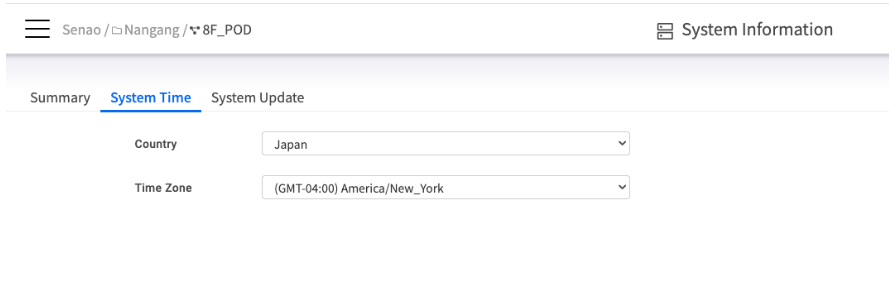
The System Time tab, showing the Country and Time Zone fields.</mark></p></figcaption></figure>

**Configuration Process**:

1. Select the **Country** where the EDCC platform is physically located
2. Select the specific **Time Zone** for that country
3. Click **Apply**

#### **Understanding Time Zone Hierarchy**

{% hint style="danger" %}
&#x20;**Important: Platform Time Zone vs. POD Time Zone**

It's crucial to understand the difference between the two time zone settings in EDCC:
{% endhint %}

| Setting                                                 | Scope                                          | Purpose                                                                              | Impact                                       |
| ------------------------------------------------------- | ---------------------------------------------- | ------------------------------------------------------------------------------------ | -------------------------------------------- |
| **Platform Time Zone** (set here)                       | Affects platform-wide logs, like the Event Log | Ensures all administrative actions are recorded with consistent, accurate timestamps | Security audits, troubleshooting correlation |
| **POD Time Zone** (set in CONFIGURE → General Settings) | Affects node-specific schedules within a POD   | Allows scheduling maintenance for a POD in its own local time                        | Firmware provisioning, maintenance windows   |

***

### Task 3: Upgrading the EDCC Platform (The System Update Tab)

This tab is used exclusively for upgrading the EDCC application software to newer versions. Keeping your platform up-to-date is essential for accessing new features, performance improvements, and critical security patches.

<figure><img src="https://content.gitbook.com/content/iGPGTG6LFrVfBRB76ZPF/blobs/wYd3EUylalj9rHp27lci/image.png" alt=""><figcaption><p><mark style="background-color:$info;">
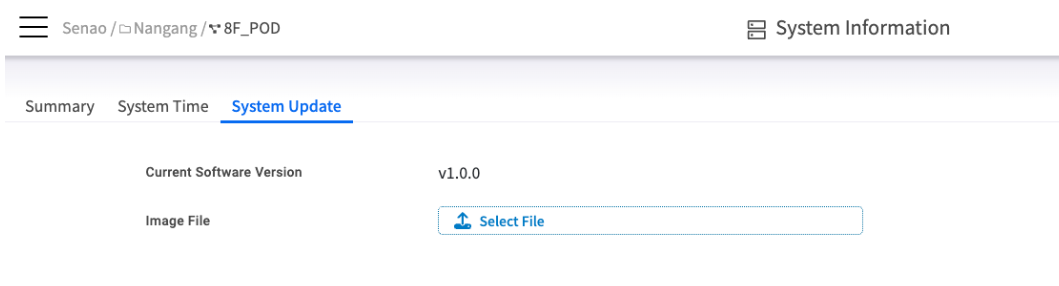
The System Update tab, showing the version display and file upload interface.</mark></p></figcaption></figure>

**Update Process**:

1. The **Current Software Version** field displays the version of EDCC currently running
2. Click **Select File** to browse for and upload the official EDCC update file (.img) provided by EnGenius
3. Follow the on-screen prompts to complete the upgrade process

#### **Update Types Clarification**

{% hint style="danger" %}
**Common Mistake: Platform Update vs. Node Firmware Update**

Do not confuse updating the EDCC platform with updating node firmware.
{% endhint %}

| Update Type               | Target                                           | Purpose                                          | Location                          |
| ------------------------- | ------------------------------------------------ | ------------------------------------------------ | --------------------------------- |
| **System Update** (here)  | Upgrades the EDCC management software itself     | Platform features, security patches, performance | System → System Information       |
| **Firmware Provisioning** | Upgrades the BMC/BIOS firmware on EnGenius nodes | Node hardware functionality, security            | CONFIGURE → Firmware Provisioning |

***

### Platform Health Monitoring Best Practices

#### **Performance Monitoring Guidelines**

**Daily Health Checks**:

* Review resource usage meters for trends
* Monitor system uptime for unexpected reboots
* Check for available software updates

**Capacity Planning Thresholds**:

<table><thead><tr><th width="109.8203125">Resource</th><th width="162.42578125">Warning Level</th><th width="209.30078125">Action Required</th><th>Expansion Planning</th></tr></thead><tbody><tr><td><strong>CPU</strong></td><td>>75% sustained</td><td>Investigate high-load processes</td><td>Consider more CPU cores</td></tr><tr><td><strong>Memory</strong></td><td>>80% sustained</td><td>Check for memory leaks</td><td>Plan RAM upgrade</td></tr><tr><td><strong>Disk</strong></td><td>>85% used</td><td>Clean up logs, plan expansion</td><td>Add storage capacity</td></tr></tbody></table>

### **Troubleshooting Performance Issues**

**Common Symptoms and Causes**:

* **Slow web interface**: High CPU or memory usage
* **Unresponsive pages**: Disk I/O bottlenecks or full disk
* **Connection timeouts**: Resource exhaustion on host system
* **Failed operations**: Insufficient system resources

**Diagnostic Steps**:

1. Check resource meters for bottlenecks
2. Review system uptime for recent reboots
3. Verify adequate free disk space
4. Consider host system scaling if consistently high resource usage

***

## Chapter Summary & Key Takeaways

* **This Page is for the Host**: The settings and monitors here relate to the machine running EDCC, not the nodes being managed
* **Monitor Host Resources**: High CPU, Memory, or Disk usage on the host will directly impact EDCC's performance and responsiveness
* **Platform Time is for Logs**: The platform time zone ensures accurate timestamps in your global Event Log for auditing
* **POD Time is for Schedules**: The POD time zone ensures maintenance windows run at the correct local time for that POD
* **Platform Updates are Separate**: Updating the EDCC software here is a different process from updating the firmware on your nodes
* **Proactive Monitoring**: Regular health checks prevent performance issues before they impact operations

**What's Next**: Chapter 16.3 will explore Application Settings configuration, where you'll learn to configure mail servers and file sharing for EDCC operations.

> 💡 **Pro Tip**: Set up a regular schedule to check platform health, especially before major operations like bulk firmware updates or large node deployments.
