| Profile Type | Use Case | Configuration Strategy |
|---|---|---|
| Standard Operations | Use the Default profile with moderate check interval | Routine, everyday monitoring with good balance between responsiveness and system overhead |
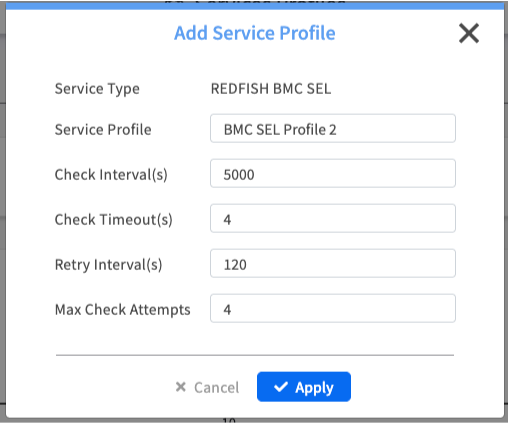
| Maintenance Window | Create "Maintenance Check" profile with short check interval | Rapid feedback on system status after making changes |
| Troubleshooting | Design "Intensive Diagnostics" profile with high retry attempts | Apply to problematic nodes to diagnose intermittent connectivity issues |
| Low-Priority Systems | Create "Relaxed" profile with long check interval | Reduce monitoring overhead on non-critical lab or development systems |
| Service Category | Purpose & User Impact |
|---|---|
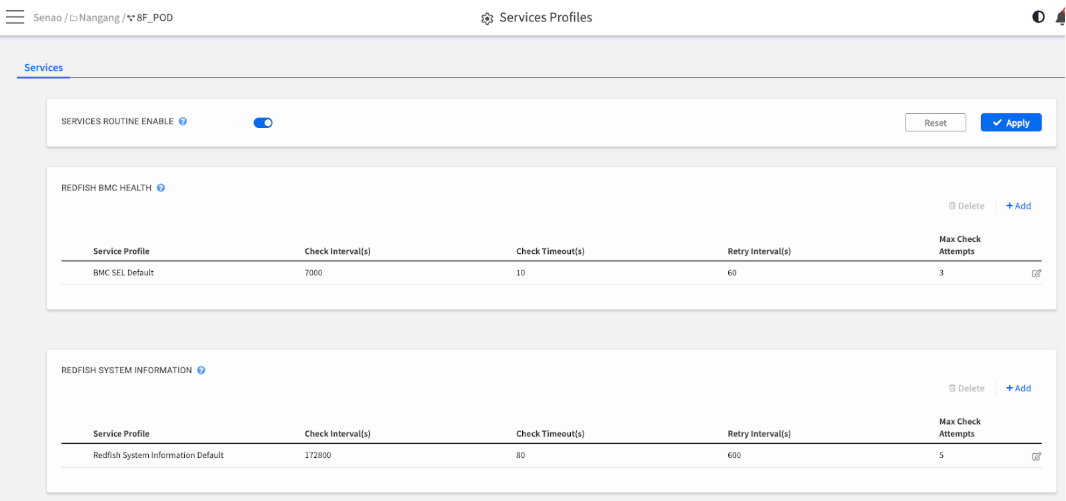
| REDFISH BMC HEALTH | Focus: Fault Detection. This service periodically checks the node's System Event Log (SEL) for new Critical or Warning events (e.g., fan failures, overheating). A failure here directly impacts the POD Health widget on the Dashboard. This is your primary proactive problem detection service. |
| REDFISH SYSTEM INFORMATION | Focus: Asset Synchronization. This service periodically retrieves static hardware specifications (e.g., model, serial numbers, firmware versions). A failure here means the hardware list in System Information may be out-of-date, but it does not typically indicate an immediate hardware fault. |
| Parameter | Description & Why It Matters (The Trade-offs) |
|---|---|
| Check Interval(s) | How often to check. A lower value (e.g., 60s) means faster detection of new events, but it also creates more network traffic and a higher load on the nodes' BMCs. A higher value is less resource-intensive but has a longer detection time. |
| Check Timeout(s) | How long to wait for a response. A shorter timeout will quickly identify unresponsive BMCs, but might generate false positives on a heavily congested network. A longer timeout is more tolerant of slow networks but will take longer to detect a truly offline BMC. |
| Retry Interval(s) | How long to wait between retries. This is the "cool-down" period after a failed check before trying again. |
| Max Check Attempts | How many times to retry. The maximum number of times EDCC will retry a failed check before marking the service as down and generating an alert. A higher number makes the check more resilient to temporary network blips. |