| Widget | What It Tells Me | Interactive Action | Priority |
|---|---|---|---|
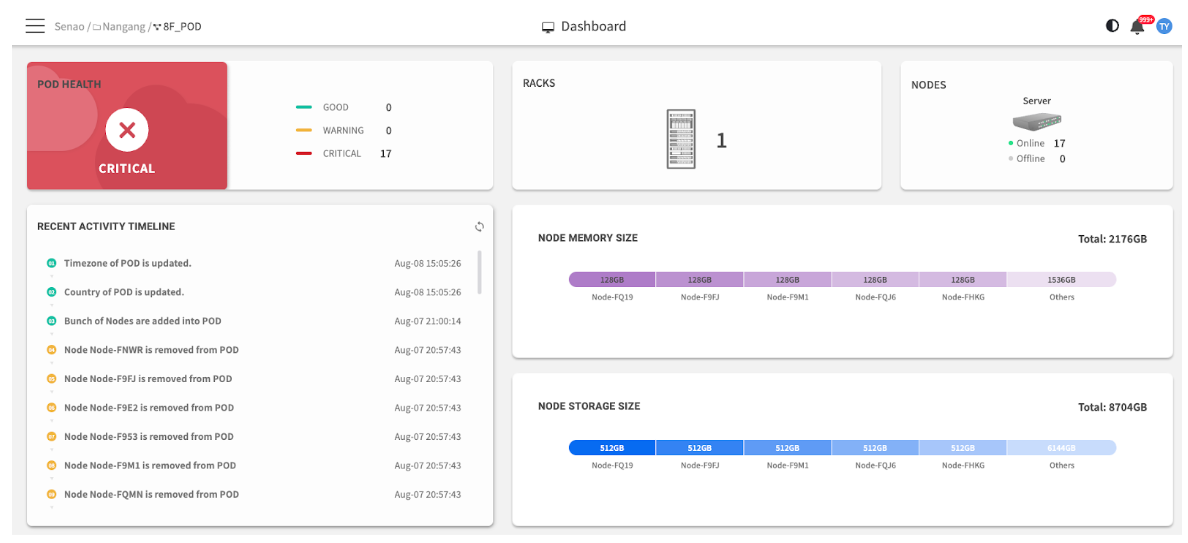
| POD Health | An immediate, color-coded health summary showing the number of nodes with unresolved Critical or Warning events from their BMC SELs. | Clicking the status takes you directly to the Services page, pre-filtered to show the specific nodes reporting issues. | 🔴 HIGHEST |
| Racks & Nodes | A quick inventory count showing: • Nodes: Total nodes in this POD with Online vs. Offline breakdown • Racks: Number of logical racks created in POD View (only counted when nodes are assigned to racks) | Clicking the Nodes count navigates directly to the Node List for detailed view. | 🟡 HIGH |
| Widget | What It Tells Me | Interactive Action | Purpose |
|---|---|---|---|
| Resource Distribution | A visual breakdown of the total installed capacity of Memory and Storage across your nodes. This is for capacity planning, not real-time usage. | (No link) Read-only informational chart. | Planning Tool |
| Widget | What It Tells Me | Interactive Action | Purpose |
|---|---|---|---|
| Recent Activity Timeline | A log of the most recent administrative actions performed in EDCC, such as configuration changes or firmware updates. | (No link) Read-only audit log. | Audit Trail |
| Nodes Status History | A historical line graph tracking the number of online and offline nodes over time. Useful for identifying trends or pinpointing outage timing. | (No link) Read-only historical chart. | Trend Analysis |
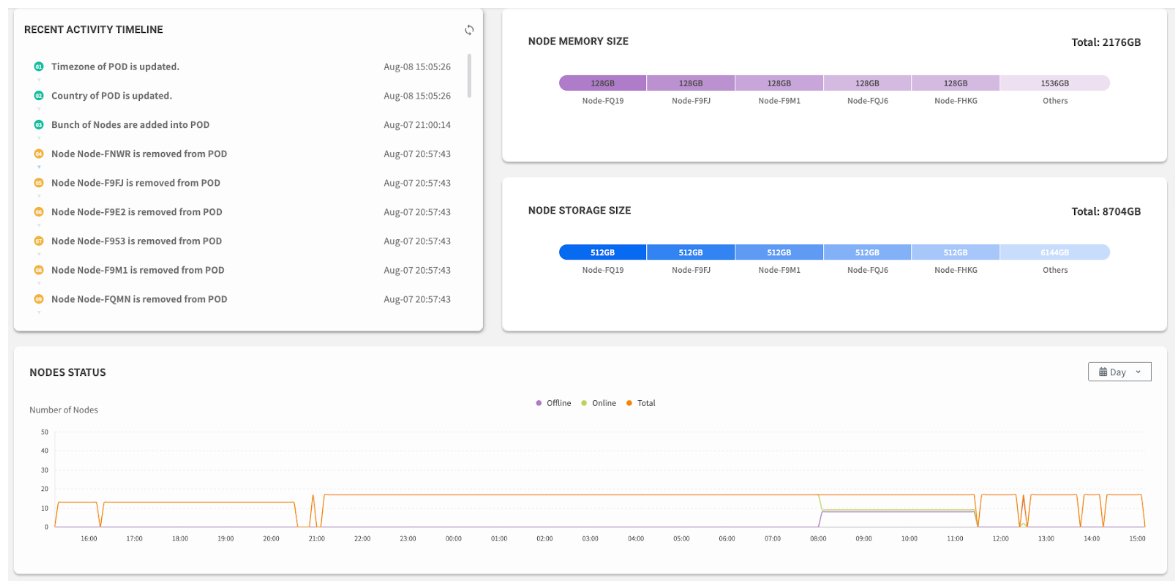
The lower section of the dashboard, focusing on the Recent Activity Timeline and the Nodes Status history graph
| Status | Color | Meaning | What the Number Shows |
|---|---|---|---|
| GOOD | 🟢 Green | No nodes have critical or warning events | No number displayed |
| WARNING | 🟡 Yellow | One or more nodes have warning-level events | Number of nodes with warnings (e.g., "2 WARNING" = 2 nodes have warnings) |
| CRITICAL | 🔴 Red | One or more nodes have critical events | Number of nodes with critical issues (e.g., "3 CRITICAL" = 3 nodes need attention) |
| From Dashboard Widget | From Dashboard Widget | Takes You To |
|---|---|---|
| POD Health with issues | Click the status | Services page (filtered to problem nodes) |
| Nodes count | Click the number | Node List (all nodes in POD) |
| Offline node indicator | Click through to Node List | Node List (can filter by status) |