# Monitoring Services Health

## Chapter 8: Monitoring Services Health

A centralized dashboard for viewing the health of internal Redfish services across your infrastructure.

> ℹ️ **Service Monitoring**
>
> * **Available to**: All user roles with monitoring permissions
> * **Scope**: Organization / Hierarchy View / POD levels
> * **Permissions**: Monitor service health status for authorized scope
> * **Purpose**: Fleet-wide Redfish service health monitoring across different management scopes

***

## Overview: Your Fleet-Wide Systems Check

The **`MANAGE → Services`** page is your fleet-wide systems check for the internal management engine. While the Node Detail → Services tab focuses on a single node, this page provides a high-level, aggregated view. Its primary purpose is to help you diagnose issues with the management plane itself.

#### **Scope-Based Visibility**:

* **Organization scope**: View service health across all PODs you have access to
* **Hierarchy View scope**: View service health across PODs within the selected Hierarchy View
* **POD scope**: View service health for nodes within the selected POD

If EDCC is having trouble communicating with one or more nodes, this is the first place to look to understand the scope of the problem. It helps you quickly answer key questions depending on your selected scope:

* **Organization/HV level**: "Is there a widespread service issue affecting multiple PODs?"
* **POD level**: "Is there a widespread service issue affecting multiple nodes in this POD?"
* **All levels**: "Is this a systemic problem or an isolated incident?"

***

## Understanding Scope-Based Monitoring

### **How Scope Affects Service Monitoring**

The services you see on this page depend on your currently selected management scope. This dynamic filtering helps you focus on the relevant infrastructure without being overwhelmed by nodes outside your current context.

#### **Scope Selection Examples**:

<table><thead><tr><th width="144.8828125">Selected Scope</th><th width="243.75">What You See</th><th>Example Use Case</th></tr></thead><tbody><tr><td><strong>Organization</strong></td><td>All nodes from all authorized PODs</td><td>Global infrastructure health check across entire organization</td></tr><tr><td><strong>Hierarchy View</strong></td><td>All nodes from PODs within selected HV</td><td>Regional data center monitoring (e.g., "East Coast HV" shows POD1, POD2, POD3)</td></tr><tr><td><strong>POD</strong></td><td>All nodes within selected POD</td><td>Detailed investigation of specific POD issues</td></tr></tbody></table>

**Permission Filtering**:

```
User with POD1, POD3, POD5 access:
• Select "Organization" → See nodes from POD1 + POD3 + POD5
• Select "HV1" (contains POD1,2,3,4,5) → See nodes from POD1 + POD3 only
• Select "POD1" → See nodes from POD1 only
```

{% hint style="success" %}
**Scope Navigation Tip**: Use the hamburger menu (top-left) to switch between Organization, Hierarchy View, and POD scopes. The header always shows your current selection.
{% endhint %}

***

## The Monitoring & Triage Workflow

The interface is designed for a simple, two-step workflow: first, get a high-level overview from the status list, then use the powerful filtering and action tools to investigate specific problems.

**`Select Scope`** <i class="fa-right">:right:</i> **`Flest Status Overview`**  <i class="fa-right">:right:</i>  **`Filter Problem Nodes`**  <i class="fa-right">:right:</i> **`Investigate Individual Issues`**

### **Multi-Scope Investigation Pattern**

**Top-Down Approach** (Recommended for widespread issues):

1. **Organization view**: Identify which PODs are affected
2. **Narrow to HV**: Focus on specific regional or logical groupings
3. **Drill to POD**: Investigate specific node issues
4. **Node Detail**: Deep-dive individual server diagnostics

**Targeted Approach** (For known issues):

1. **Direct POD selection**: Jump straight to affected POD
2. **Filter critical nodes**: Isolate problem servers
3. **Use quick actions**: Navigate to diagnostic pages

***

### Reading the Node Service Status List

**Overview**: This table is your main dashboard, acting as a "fleet status board" for the selected service. Each row represents a node, and each column gives you a piece of critical diagnostic information. It allows you to spot systemic issues at a glance, for example, if a recent network change has impacted communication for multiple nodes across different PODs.

<div align="left"><figure><img src="https://content.gitbook.com/content/iGPGTG6LFrVfBRB76ZPF/blobs/bxQibKwbMrBg6kfEJDgY/image.png" alt=""><figcaption><p><mark style="background-color:$info;">
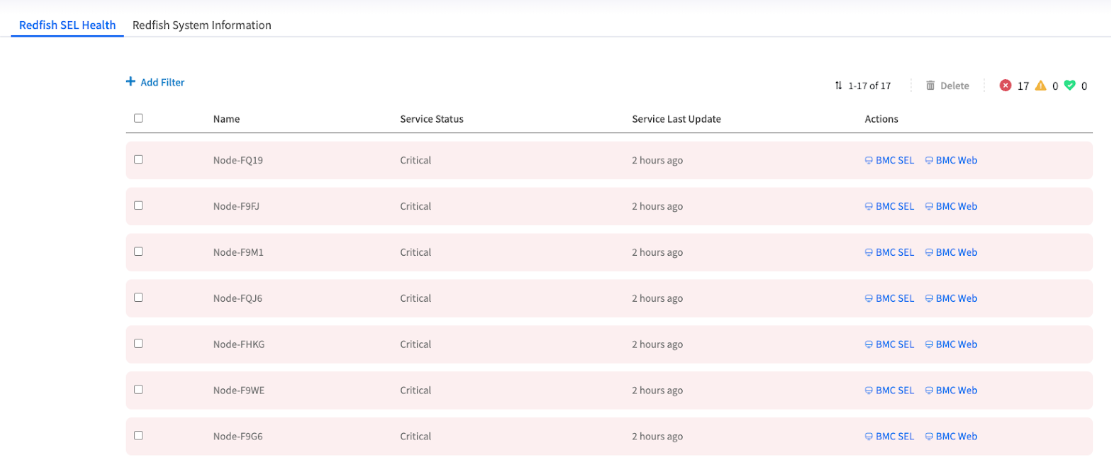
The Redfish SEL Health view showing a list of nodes, with some marked as critical</mark></p></figcaption></figure></div>

<table><thead><tr><th width="110.33984375">Column</th><th width="361.80859375">Description &#x26; Why It Matters</th><th>Diagnostic Value</th></tr></thead><tbody><tr><td>Name</td><td>Identifier: The unique name of the node.</td><td>Node identification</td></tr><tr><td>Service Status</td><td>The Key Indicator: This shows the current health of the selected service on that node (Critical, Good). The entire row is color-coded, so you can spot failing nodes instantly.</td><td><strong>PRIMARY</strong> - Immediate health status</td></tr><tr><td>Service Last Update</td><td>The "Heartbeat" Timestamp: This shows the last time EDCC successfully received a status update from this service. A stale or old timestamp is a major red flag, indicating a potential network issue or an unresponsive BMC.</td><td><strong>CRITICAL</strong> - Communication health</td></tr><tr><td>Actions</td><td>Your Investigation Shortcuts: These are dynamic, context-aware links designed to take you directly to the most relevant page for troubleshooting that specific service failure.</td><td><strong>TOOLS</strong> - Direct investigation paths</td></tr></tbody></table>

#### **Key Monitoring Indicators**

**Service Status Priority**:

* **Critical (Red)**: Immediate attention required - service failure detected
* **Good (Green)**: Service operating normally
* **Missing Status**: Possible communication failure

**Service Last Update Analysis**:

* **Recent Timestamp**: Normal communication with BMC
* **Stale Timestamp**: Warning sign of network or BMC issues
* **Missing Timestamp**: Communication completely broken

#### **Cross-Scope Pattern Recognition**

**What to Look For**:

* **Organization view**: Are problems concentrated in specific PODs?
* **Hierarchy View**: Are issues affecting one region more than others?
* **POD view**: Are problems clustered on specific racks or network segments?
* **All scopes**: Are similar services failing across multiple nodes?

***

### Filtering and Investigating

#### **Filtering for Problem Nodes**

In a large deployment with hundreds of nodes across multiple PODs, the filter is your most essential tool. It allows you to cut through the noise and instantly isolate the nodes that need attention, regardless of your current scope.

**Process**:

1. Click the **+ Add Filter** button
2. Filter the list by **Name** or **Service Status**
3. Click **Apply**

<div align="left"><figure><img src="https://content.gitbook.com/content/iGPGTG6LFrVfBRB76ZPF/blobs/caRziRBDuKYLIMQRa5ZJ/image.png" alt=""><figcaption><p><mark style="background-color:$info;">
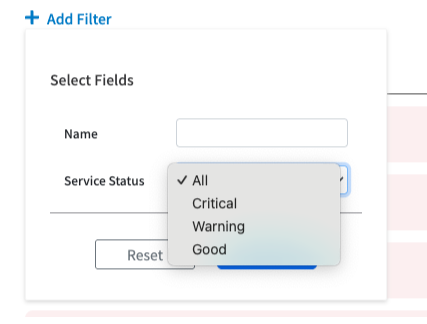
The filter dialog showing the options to filter by Name and Service </mark><em><mark style="background-color:$info;">Status</mark></em></p></figcaption></figure></div>

#### **Common Filter Scenarios by Scope**:

**Organization/HV Scope**:

* **Critical Status Only**: Find all critical nodes across multiple PODs
* **POD-Specific Issues**: Filter by node names containing POD identifiers
* **Stale Updates**: Identify communication problems across infrastructure

**POD Scope**:

* **Critical Status Only**: Focus on nodes requiring immediate attention
* **Rack-Based Filtering**: Filter by naming patterns for specific racks
* **Service Type Issues**: Isolate specific service failures

### **Using Quick Actions to Drill Down**

The Actions column provides the most efficient path from problem detection to root cause investigation. These shortcuts are designed to minimize "context switching" by providing a direct, one-click path to the most relevant diagnostic page.

#### **Action Options by Service Type**:

| Service Type                   | Available Actions    | Purpose                                    |
| ------------------------------ | -------------------- | ------------------------------------------ |
| **Redfish SEL Health**         | BMC SEL, BMC Web     | Jump to event logs or native BMC interface |
| **Redfish System Information** | System Info, BMC Web | Access hardware details or BMC interface   |

#### **Investigation Path**:

**`Flest View Problem`&#x20;**&#x20;<i class="fa-right">:right:</i> **`Quick Action`** <i class="fa-right">:right:</i> **`Node-Level Diagnostics`** <i class="fa-right">:right:</i> **`Root Cause Resolution`**

{% hint style="success" %}
**Cross-Scope Navigation**: Quick Actions work the same way regardless of your selected scope, always taking you to the specific node's diagnostic page.
{% endhint %}

***

## Managing Service Events

### **Understanding the Batch "Delete" Action**

This function is an administrative tool for managing the user interface, not the nodes themselves. After you have resolved a widespread service issue, you can use this batch action to clear the resolved Critical status indicators from this screen in a single operation.

{% hint style="danger" %}
**Important: This is Not a Node Deletion**

The Delete button on this page **DOES NOT** remove the node from the POD. It is purely an administrative action for clearing the selected service event records from this UI screen only.
{% endhint %}

**When to Use Delete Action**:

* **After Issue Resolution**: Clear resolved service alerts from the display
* **UI Cleanup**: Remove outdated status indicators after maintenance
* **Event Management**: Maintain clean service status overview
* **Works Across All Scopes**: Clean up events regardless of Organization/HV/POD selection

**What Delete Does NOT Do**:

* Remove nodes from POD
* Delete actual service configurations
* Affect node functionality
* Remove nodes from other EDCC functions
* Change your current scope selection

***

## Chapter Summary & Key Takeaways

* **Multi-Scope Monitoring**: This page works across Organization, Hierarchy View, and POD scopes - not POD-only
* **Dynamic Visibility**: What you see depends on your selected scope and user permissions
* **Use This Page for Fleet-Wide Issues**: Best for spotting problems that affect multiple nodes across your authorized infrastructure
* **Last Update is a Key Indicator**: A stale timestamp can be a sign of a network or BMC connectivity issue, even if the status is "Good"
* **Actions are Your Shortcuts**: Use the Actions column to jump directly from fleet-level alerts to node-level diagnostic pages
* **Delete Clears the View, Not the Node**: The batch Delete action is for UI cleanup only and does not affect nodes or your scope selection
* **Pattern Recognition**: Look for patterns across multiple nodes and PODs to identify systemic issues vs. isolated problems
* **Scope Switching**: Use the hamburger menu to navigate between different scopes for top-down or targeted investigation

**What's Next**: Chapter 9 will explore POD View topology management, where you'll learn to visualize and organize your infrastructure layout.

> 💡 **Pro Tip**: Use **Organization or HV** scope as your first stop when Dashboard shows widespread health issues - it quickly reveals whether problems are affecting specific PODs or multiple systems across your infrastructure. Then narrow your scope to investigate specific problem areas.
