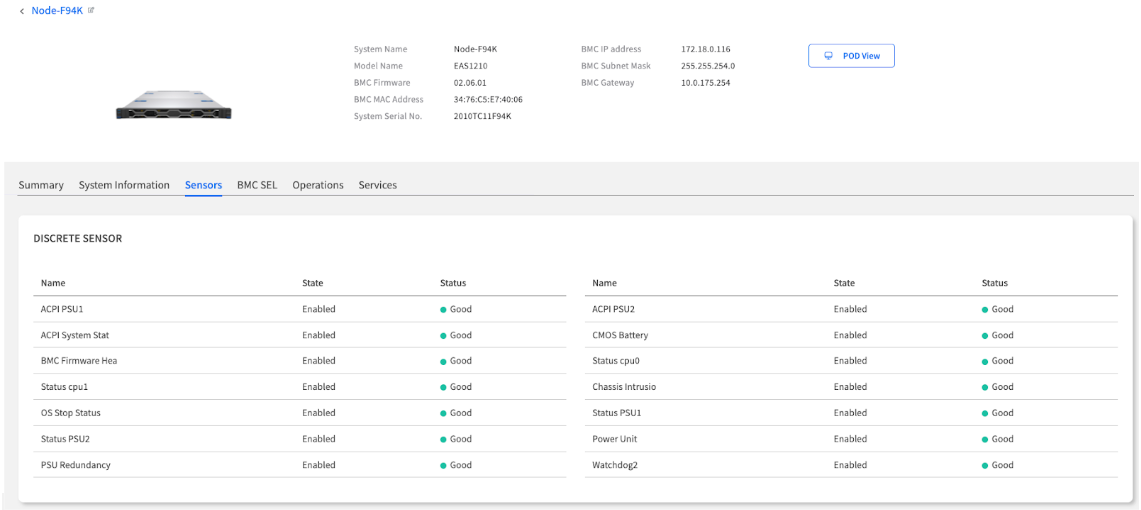
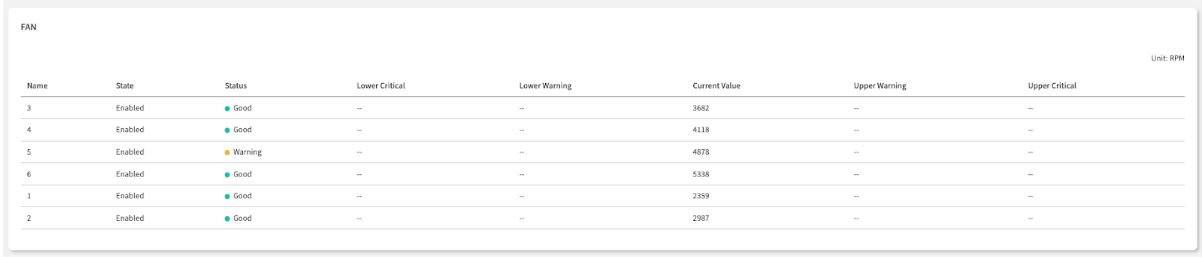
# Sensors

## Chapter 7.3: Monitoring Hardware Sensors

Your toolkit for precise, in-depth hardware health diagnostics.

> ℹ️ **Hardware Sensor Monitoring**
>
> * **Available to**: All user roles
> * **Scope:** Individual node level
> * **Permissions**: Read-only for all users
> * **Data Source:** Real-time readings from BMC sensors via Redfish protocol

## Overview

The **`Sensors`** **tab** is your tool for detailed hardware diagnostics. While the Summary tab's graphs help you spot trends over time, this page provides the exact, real-time numerical values and the official manufacturer-defined operating thresholds for every sensor in the node. This is the difference between seeing a fever chart and reading the exact temperature on a digital thermometer.

All data here is polled directly from the Baseboard Management Controller (BMC), making it completely independent of the operating system. Use this read-only page to answer one critical question: "Is this component currently operating within its safe, predefined limits?"

{% hint style="warning" %}
&#x20;**Always Get the Latest Data**

The sensor data is a snapshot from when the page was loaded. To get the most up-to-the-minute readings from the node's BMC, remember to perform a **manual browser refresh (F5)**.
{% endhint %}

## How to Triage a Sensor's Health

The tables on this page are designed for quick and accurate assessment. To interpret any sensor reading, follow this three-step process.

### Three-Step Health Assessment Process

1. **Check the Status:** Look at the color-coded dot first for an immediate health summary.
2. **Read the Current Value**: See the real-time measurement being reported by the component.
3. **Compare with Thresholds**: Verify where the current value falls within the hardware's official safe operating range.

#### Sensor Table Column Reference

<table><thead><tr><th width="119.03125">Column</th><th width="377.8125">Description &#x26; Why It Matters</th><th>How to Use</th></tr></thead><tbody><tr><td>Status</td><td>Your At-a-Glance Health Indicator: Good is normal. Warning or Critical means the sensor has crossed a predefined threshold and requires immediate attention.</td><td>First check - prioritize non-green statuses
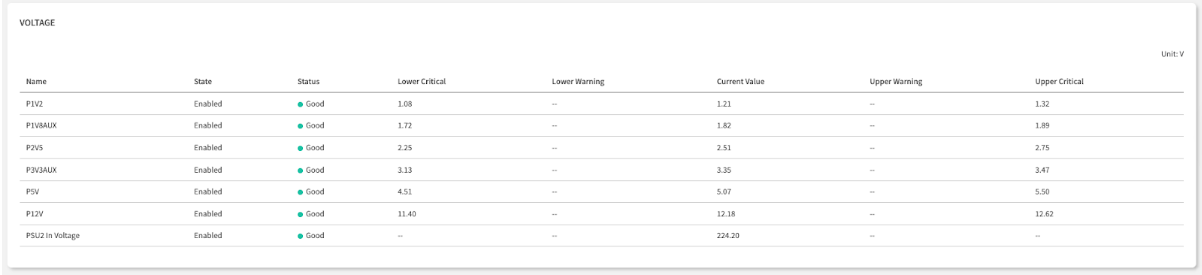
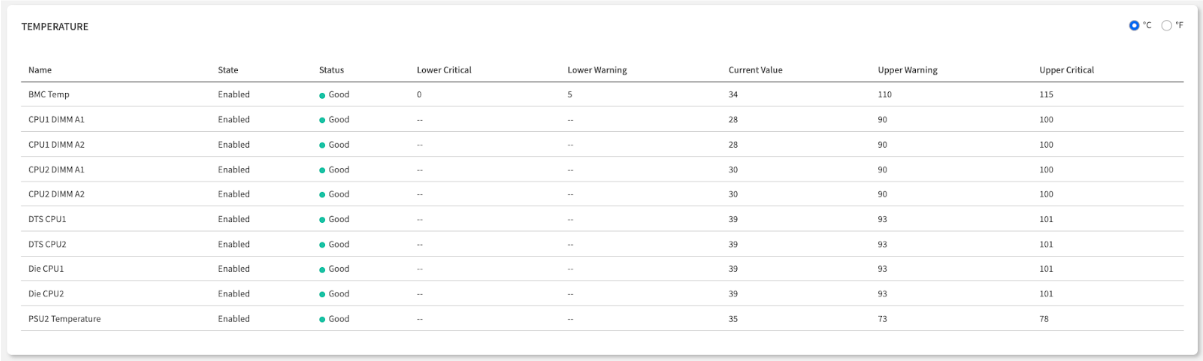
</td></tr><tr><td>Current Value</td><td>The Real-Time Reading: The precise, real-time measurement from the sensor (e.g., Volts, RPM, °C).</td><td>Exact measurement - compare against expected ranges</td></tr><tr><td>Thresholds</td><td>The Official Safe Operating Limits: These read-only values are defined by the hardware manufacturer. A Current Value outside these boundaries triggers a Status change.</td><td>Reference ranges - understand normal vs. abnormal</td></tr></tbody></table>

{% hint style="warning" %}
**Diagnostic Priority:** Always start with **Critical** status sensors, then **Warning**, then verify **Good** sensors for baseline understanding.
{% endhint %}

## Sensor Category Deep Dive

Each category of sensors provides insight into a different aspect of the node's physical health.

### Discrete Sensors

These sensors act as simple binary (on/off, true/false) indicators for various system states. They are excellent for quick, definitive checks.

#### **Common Examples:**

* **Chassis Intrusion:** Detects if the case has been opened
* **PSU Redundancy:** Confirms if the redundant power supply is healthy
* **System Status:** Overall system health indicators

🖼️ <mark style="background-color:$success;">$$Image: The Discrete Sensor table, showing examples like PSU Redundancy and Chassis Intrusion status.$$</mark>

<figure><img src="https://content.gitbook.com/content/iGPGTG6LFrVfBRB76ZPF/blobs/LN778sq0SmOAbxvJRUVu/image.png" alt=""><figcaption></figcaption></figure>

#### **Interpretation Guide:**

* **Good/OK**: Component functioning normally
* **Warning**: Attention required but not critical
* **Critical**: Immediate action required

### Voltage Sensors

Think of these as the "heartbeat" and "blood pressure" monitor for the node's power system. They ensure that stable and correct voltages are being delivered to sensitive components.

#### How to Interpret:

* **Normal Behavior:** Current Value should be extremely stable.
* **Warning Signs:** Significant fluctuations or drifts into Warning range.
* **Potential Issues:** Early indicator of failing Power Supply Unit (PSU) or motherboard issue.

🖼️ <mark style="background-color:$success;">$$Image: The Voltage sensor table, highlighting the Current Value in relation to the warning and critical thresholds.$$</mark>

<figure><img src="https://content.gitbook.com/content/iGPGTG6LFrVfBRB76ZPF/blobs/6gYAefSE0ypECsNivfKb/image.png" alt=""><figcaption></figcaption></figure>

#### **Critical Voltage Rails to Monitor:**

* **12V Rails:** Primary power distribution
* **5V Rails:** Legacy component power
* **3.3V Rails**: Logic and memory power

### Fan Sensors

These sensors are the "respiratory check" for the node's cooling system, reporting the speed (RPM) of each fan.

<div align="left"><figure><img src="https://content.gitbook.com/content/iGPGTG6LFrVfBRB76ZPF/blobs/Qm6jc8OQDg0hQ82Frjli/image.png" alt=""><figcaption></figcaption></figure></div>

#### How to Interpret:

A fan's status is determined by comparing its Current Value (RPM) against its predefined Thresholds.

* **Good:** The fan is spinning within its normal, expected RPM range.
* **Warning:** The fan's speed is too slow (impending failure) or too fast (high heat load), crossing a Warning threshold. This requires investigation.
* **Critical:** The fan's speed has crossed a Critical threshold. This could mean it is spinning dangerously slow, dangerously fast, or has stopped entirely (0 RPM). This state requires immediate attention.

{% hint style="success" %}
**Fan Monitoring Best Practices:**

* **Redundancy Check:** Verify multiple fans are operational.
* **RPM Consistency**: Compare similar fans for consistent speeds.
* **Trend Analysis:** Monitor for gradual RPM degradation.
  {% endhint %}

### Temperature Sensors

This is the **"fever check**" for your node, providing precise temperature readings from critical components. This is your primary tool for identifying and preventing overheating.

#### How to Interpret:

* **Normal Operation**: Temperatures within manufacturer specifications.
* **High Load:** Elevated but within acceptable ranges during heavy workloads.
* **Cooling Issues**: Sustained high temperatures indicating cooling system problems.

🖼️ <mark style="background-color:$success;">$$Image: The Temperature sensor table, with the °C/°F toggle visible.$$</mark>

<figure><img src="https://content.gitbook.com/content/iGPGTG6LFrVfBRB76ZPF/blobs/hoyQjnmp4RRfs0ldG876/image.png" alt=""><figcaption></figcaption></figure>

#### Temperature Monitoring Zones:

* **CPU Zones**: Processor thermal management
* **Memory Zones**: DIMM thermal monitoring
* **Ambient Zones**: Overall chassis temperature
* **PSU Zones**: Power Supply Unit thermal monitoring

{% hint style="warning" %}
**Unit Toggle:** You can switch the display between Celsius (°C) and Fahrenheit (°F) using the toggle in the top-right corner of the table.
{% endhint %}

## From Sensor Alert to Actionable Insight

This page is your starting point for diagnosis. When you find a sensor with a non-good status, the goal is to turn that alert into actionable information for maintenance or support.

### Your Diagnostic Workflow

```
Sensor Alert → Event Correlation → Evidence Gathering → Action Planning
```

**Step-by-Step Process:**

1. **Identify the Fault:** Note the full name of the sensor reporting an issue (e.g., "CPU1 DIMM A2 Temperature").
2. **Find the Correlating Event**: Immediately navigate to the BMC SEL tab. The system automatically logs a detailed event that corresponds directly to the sensor alert.
3. **Gather the Evidence**: The event log provides the precise timestamp and error details.
4. **Take Action:** This collected evidence is exactly what you need to provide to a technician for a physical inspection or to a vendor for technical support.

### Documentation Template for Support

When escalating sensor issues, include:

* **Node Identity**: System Name and Serial Number
* **Sensor Details**: Full sensor name and current reading
* **Threshold Information**: Operating limits and current status
* **Event Log Entry**: Corresponding BMC SEL event with timestamp
* **Environmental Context**: Workload and environmental conditions

## Sensor Monitoring Best Practices

### Daily Health Check Routine

1. **Priority Scanning**: Check for any Critical or Warning status indicators.
2. **Baseline Verification:** Note normal operating ranges for your environment.
3. **Trend Correlation**: Compare with Summary tab trends for context.
4. **Event Correlation**: Cross-reference with BMC SEL for related events.

### Proactive Monitoring Strategies

#### Establish Baselines:

* Document normal operating ranges for each sensor type.
* Note typical values during different workload conditions.
* Track seasonal variations in temperature readings.

#### Early Warning Detection:

* Monitor sensors approaching warning thresholds.
* Track gradual changes that might indicate developing issues.
* Correlate sensor patterns across similar nodes.

### Integration with Other Monitoring

#### Cross-Reference Points:

* **Summary Tab:** Use graphs for trend analysis.
* **BMC SEL:** Check for corresponding system events.
* **Operations Tab**: Verify system operations impact on sensors.
* **Services Tab**: Correlate with service health status.

## Chapter Summary & Key Takeaways

* **Summary is for Trends, Sensors is for Thresholds**: Use the Summary tab to see graphs over time. Use this Sensors tab to see the exact current value and compare it against the official safe operating limits.
* **Refresh is Required**: The data is a snapshot. Always manually refresh (F5) to get the latest readings.
* **Your Goal is Evidence**: A sensor alert is your clue. The detailed event in the BMC SEL tab is your evidence for taking action.
* **Follow the Workflow**: Sensor Alert → Event Correlation → Evidence Gathering → Support Action.
* **Monitor Proactively**: Establish baselines and track trends to prevent issues before they become critical.

#### What's Next:&#x20;

Chapter 7.4 will explore the BMC System Event Log (SEL), where you'll learn to investigate the detailed hardware events that correspond to sensor alerts and system activities.

> 💡 **Pro Tip**: Create a baseline document of normal sensor readings for each node type in your environment - this makes identifying abnormal conditions much faster and more accurate.

<br>
