# Summary Tab

## Chapter 7.1: Viewing the Summary Tab

Your primary dashboard for an individual node's settings and real-time health.

> ℹ️ **Individual Server Management**
>
> * **Available to:** All user roles
> * **Scope:** POD level (individual server focus)
> * **Permissions:**
>   * **POD/Org Admin:** Full control including configuration changes
>   * **Viewer roles**: Monitor-only access (cannot modify settings)

## Overview: The Node's Command Center

The **`Summary` tab** is the most important page for the day-to-day management of a single node. This is your command center for a specific machine, combining three key functions into one view:

* **Identity Check**: Quickly verify the node's name, model, and network settings.
* **Live Health Monitoring:** View real-time graphs of the node's environmental health (fans, temperature, voltage, and power).
* **Core Configuration:** Adjust the node's essential management settings, like its BMC credentials and firmware update policy.

{% hint style="warning" %}
**Navigation Context:** You access this tab by selecting a specific node from the Node List and clicking "**Details**" or using the individual node action menu.
{% endhint %}

## Task 1: Verifying Node Identity & Hardware

The top half of the screen provides a quick-reference "digital nameplate" for the node, showing its key hardware and management identifiers. This is essential for confirming you are working on the correct machine and for asset management tasks.

<figure><img src="https://content.gitbook.com/content/iGPGTG6LFrVfBRB76ZPF/blobs/az8TkP9TyhWl6Z5WQa8n/image.png" alt=""><figcaption><p><mark style="background-color:$info;">
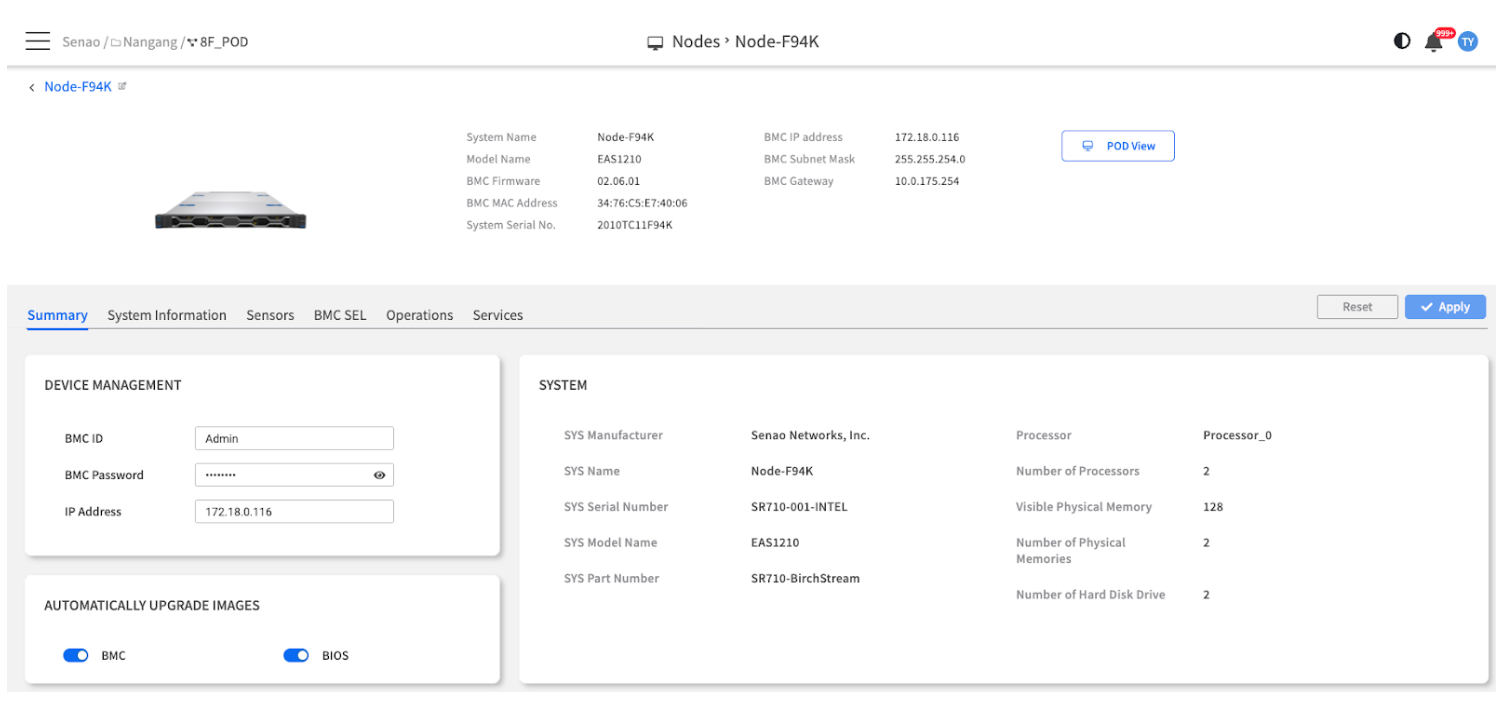
The main console view of the Node Detail Summary tab</mark></p></figcaption></figure>

### Header Information

This panel provides at-a-glance identification for the node you are currently managing.

<table><thead><tr><th width="167.3828125">Field</th><th width="328.98046875">Description &#x26; Why It Matters</th><th>Use Case</th></tr></thead><tbody><tr><td>System Name</td><td>The Node's Alias: The user-defined name of this node within EDCC.</td><td>Quick identification and inventory management</td></tr><tr><td>Model Name</td><td>Hardware Model: The specific EnGenius node model (e.g., EAS1210). Crucial for ensuring you use the correct firmware.</td><td>Firmware compatibility and hardware planning</td></tr><tr><td>BMC Firmware</td><td>Management Firmware Version: The current firmware version of the BMC. Important for security and feature audits.</td><td>Security compliance and feature availability</td></tr><tr><td>BMC MAC Address</td><td>Unique Network ID: The unique MAC address of the BMC. Essential for network troubleshooting and DHCP reservations.</td><td>Network configuration and troubleshooting</td></tr><tr><td>System Serial No.</td><td>Unique Hardware ID: The unique serial number of the node's hardware. This is the primary identifier for support tickets and asset tracking.</td><td>Support tickets and warranty management</td></tr><tr><td>BMC IP Address</td><td>Management IP: The current management IP address of the BMC. This is the address EDCC uses to communicate with the node.</td><td>Network connectivity and management access</td></tr><tr><td>BMC Subnet Mask</td><td>Network Subnet: Defines the node's local network, determining which other IPs are on the same subnet.</td><td>Network configuration and troubleshooting</td></tr><tr><td>BMC Gateway</td><td>Network Gateway: The router address for the node's BMC, enabling communication outside of its local subnet.</td><td>Network connectivity and remote access</td></tr></tbody></table>

{% hint style="success" %}
&#x20;**Asset Management Tip:** The System Serial No. is your most critical identifier for vendor support, warranty claims, and hardware inventory tracking
{% endhint %}

### System Information Panel

This is a read-only inventory of the node's key computing components, providing a quick hardware audit without needing to go to the more detailed System Information tab.

<table><thead><tr><th width="174.90234375">Field</th><th width="331.5546875">Description &#x26; Why It Matters</th><th>Typical Values</th></tr></thead><tbody><tr><td>SYS Manufacturer</td><td>The manufacturer of the server system (e.g., EnGenius).</td><td>EnGenius</td></tr><tr><td>SYS Model Name</td><td>The specific model name or SKU of the system.</td><td>EAS1210, EAS2210</td></tr><tr><td>SYS Serial Number</td><td>The main serial number for the entire system chassis.</td><td>X123456789</td></tr><tr><td>SYS Part Number</td><td>The manufacturer's part number for the system.</td><td>SKU-123-456</td></tr><tr><td>Processor(s)</td><td>The model(s) of the installed CPUs. Helps verify the node's compute capabilities.</td><td>Intel Xeon 6 (P-core/E-core variants)</td></tr><tr><td>Physical Memory</td><td>The total amount of installed RAM. A key specification for performance and capacity planning.</td><td>32GB, 64GB, 128GB configurations</td></tr><tr><td>Number of Hard Disk Drive</td><td>The number of detected storage drives. Helps verify the node's storage configuration.</td><td>12-24 drives (depending on model)</td></tr></tbody></table>

{% hint style="info" %}
**Quick Verification:** Use this panel to quickly confirm the node matches your expected hardware configuration without diving into detailed system information.
{% endhint %}

## Task 2: Monitoring Real-time Sensor Data

These graphs provide a live feed of the node's environmental health, collected directly from the BMC. They are your primary tool for spotting performance trends and potential hardware issues over time.

{% hint style="warning" %}
**Important: Refresh for Live Data**

The sensor data refreshes when the page is first loaded. For the most up-to-the-minute data, perform a manual browser refresh (F5).
{% endhint %}

### Interpreting the Sensor Charts

| Chart Type               | What It Shows                                                                           | Normal Behavior                                              | Warning Signs                                                                                               |
| ------------------------ | --------------------------------------------------------------------------------------- | ------------------------------------------------------------ | ----------------------------------------------------------------------------------------------------------- |
| Voltage Sensor Chart     | Tracks the stability of key voltage rails (e.g., 12V, 5V, 3.3V) crucial for components. | Stable voltage readings within tight, predefined tolerances. | Significant drops, spikes, or unstable fluctuations, which can indicate a failing PSU or motherboard issue. |
| Fan Sensor Chart         | Tracks the speed (RPM) of all fans.                                                     | Consistent RPM values across all fans.                       | Sudden drop to zero = fan failure or node shutdown.                                                         |
| Temperature Sensor Chart | Monitors temperatures from critical components.                                         | Normal operating ranges per component.                       | Sustained high temps = cooling issues or high workload.                                                     |
| Output Power Chart       | Shows real-time power consumption (watts) for each PSU.                                 | Both PSUs active and sharing the load in redundant systems.  | One PSU drops to zero = PSU failure or redundancy issue.                                                    |

<figure><img src="https://content.gitbook.com/content/iGPGTG6LFrVfBRB76ZPF/blobs/oORwyir2jRNfmG3wOgWh/image.png" alt=""><figcaption><p><mark style="background-color:$info;">
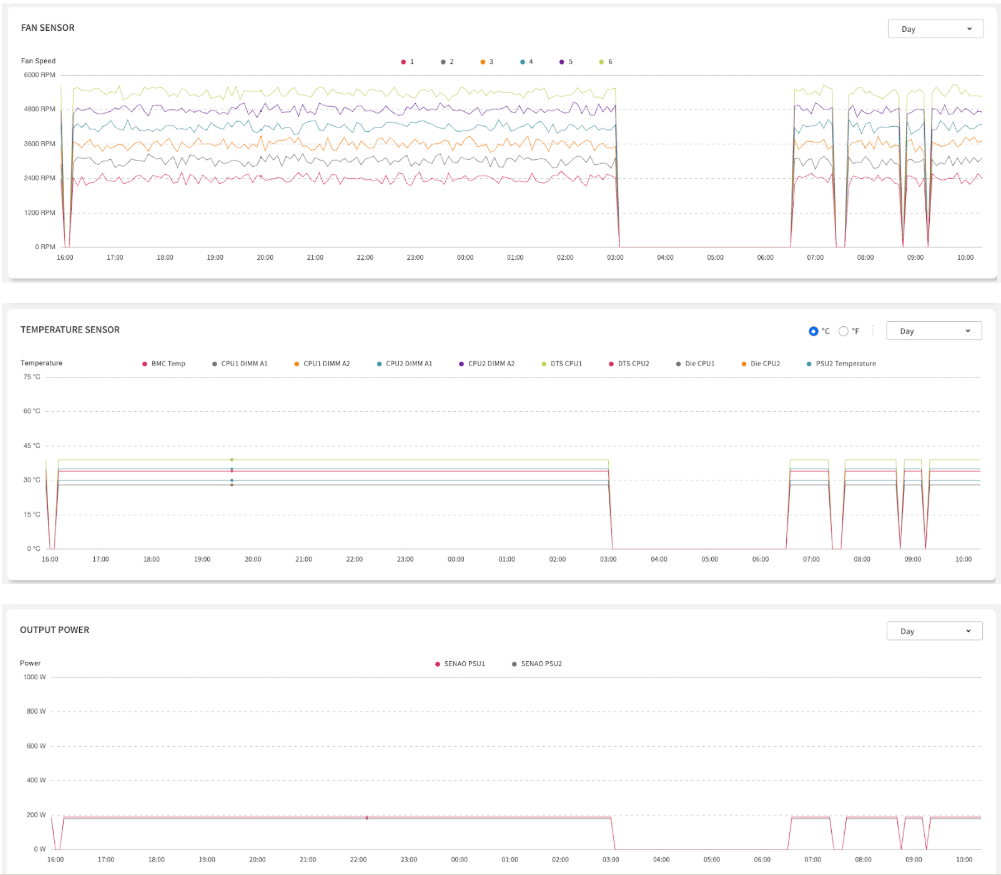
The four sensor charts for Voltage, Fan, Temperature, and Output Power
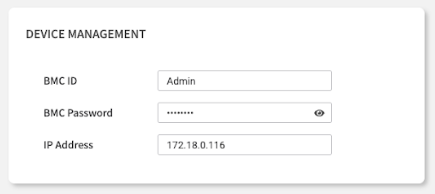
</mark></p></figcaption></figure>

### Sensor Monitoring Best Practices

#### **Daily Health Check:**

1. **Voltage Status**: Verify all voltage rails are stable and within normal range.
2. **Fan Status**: Verify all fans are operational (non-zero RPM).
3. **Temperature Trends**: Look for unusual temperature spikes or consistently high readings.
4. **Power Distribution**: Confirm PSU redundancy is working (both PSUs showing load).

#### **Trend Analysis:**

* **Compare Baselines**: Note normal operating ranges for your environment.
* **Correlate Events**: Match sensor changes with workload or environmental changes.
* **Proactive Monitoring**: Use sensor data to predict hardware maintenance needs.

💡 **Troubleshooting Tip:** Sudden sensor drops to zero (for Fans or Power) often indicate hardware failures, while unstable voltage readings or gradual temperature increases may suggest environmental issues or impending component failure.

{% hint style="success" %}
**Troubleshooting Tip:** Sudden sensor drops to zero (for Fans or Power) often indicate hardware failures, while unstable voltage readings or gradual temperature increases may suggest environmental issues or impending component failure.
{% endhint %}

## Task 3: Configuring Node-Specific Settings

Overview: This is where you can adjust core access credentials and override POD-level policies for this specific node. All changes made in this section must be saved by clicking the Apply button in the top-right corner.

{% hint style="warning" %}
**Admin Permission Required:** Configuration changes require POD Admin or Organization Admin role.
{% endhint %}

### Device Management Panel

This panel allows you to configure the core access credentials EDCC uses to connect to the node's BMC.

<table><thead><tr><th width="169.94921875">Field</th><th width="260.76953125">Description &#x26; Why It Matters</th><th>Configuration Notes</th></tr></thead><tbody><tr><td>BMC ID / Password</td><td>The Login Credentials: The username and password EDCC uses to log in to this node's BMC.</td><td>⚠️ <strong>Critical:</strong> If you manually change the password on the BMC's web interface, you must update it here, or EDCC will lose management access.</td></tr><tr><td>IP Address</td><td>The Management Address: The management IP address of the node's BMC.</td><td><strong>Network Impact:</strong> Changing this value will directly reconfigure the BMC's network settings.
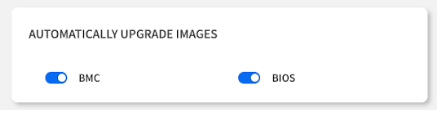
</td></tr></tbody></table>

{% hint style="warning" %}
**Security Best Practice**: Use strong, unique passwords for BMC access and update them regularly according to your security policy.
{% endhint %}

<div align="left"><figure><img src="https://content.gitbook.com/content/iGPGTG6LFrVfBRB76ZPF/blobs/D386MgUqnts2O2P1Vffm/image.png" alt=""><figcaption></figcaption></figure></div>

### Automatically Upgrade Images Panel

Overview: This panel enables or disables automatic firmware updates for this specific node, allowing you to make it an exception to the POD-wide policy.

<div align="left"><figure><img src="https://content.gitbook.com/content/iGPGTG6LFrVfBRB76ZPF/blobs/gP7q1QlmwzWbflgN5QiJ/image.png" alt=""><figcaption></figcaption></figure></div>

<table><thead><tr><th width="201.890625">Setting</th><th width="284.234375">Description</th><th>Use Cases</th></tr></thead><tbody><tr><td>BMC Firmware Toggle</td><td>Include/exclude this node from automated BMC firmware updates.</td><td>Exclude critical production systems during maintenance windows.</td></tr><tr><td>BIOS Firmware Toggle</td><td>Include/exclude this node from automated BIOS firmware updates.</td><td>Prevent updates on systems with specific BIOS requirements.</td></tr></tbody></table>

#### **How it Works:**

* **Enabled**: This node will be included in the automated updates scheduled for the entire POD.
* **Disabled**: This node will be skipped, even if a new firmware version is available.

#### **When to Use:**

* **Exclude Critical Systems**: Temporarily exclude a sensitive production node from a scheduled update.
* **Prevent Test Updates**: Stop a development node from being automatically upgraded.
* **Maintenance Windows**: Exclude nodes during planned maintenance periods.
* **Compliance Requirements**: Maintain specific firmware versions for regulatory compliance.

{% hint style="success" %}
**Planning Tip**: Use node-level overrides strategically to maintain system stability while still benefiting from automated updates for non-critical systems.
{% endhint %}

## Chapter Summary & Key Takeaways

* **It's a 3-in-1 Tool**: Use it to Identify, Monitor, and Configure a single node.
* **Check Serial Number**: The System Serial No. is your most important identifier for support and asset management.
* **Monitor for Drops:** In the sensor charts, watch for sudden drops to zero (Fans, Power) or fluctuations (Voltage), as they usually indicate a hardware issue.
* **Click Apply:** No configuration changes take effect until you click the Apply button.
* **Refresh for Real-time Data:** Manual browser refresh (F5) is required to get the latest sensor readings from the BMC.
* **Permission Awareness**: Configuration features require Admin role - Viewers can only monitor.

#### **What's Next:**&#x20;

Chapter 7.2 will explore the System Information tab, where you'll find a comprehensive hardware inventory and detailed component specifications.

> 💡 **Daily Routine:** Make the Summary tab your first stop when investigating individual node issues—it provides the perfect balance of identification, monitoring, and quick configuration access.

<br>
